Global T-shirt Statistics
Revenue in the Global T-Shirts segment amounted to US $43.47bn in 2022. Research shows the market is expected to grow annually by 3.90% (Statista)
In relation to total population figures, global per person revenues of US $5.71 were generated in 2022 (Statista)
The T-Shirts segment is expected to show a global volume growth of 5.5% in 2023 (Statista)
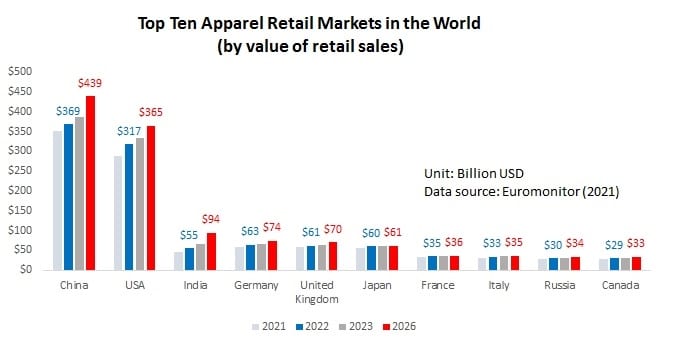
The average volume per person in the global T-Shirts segment was 0.93 pieces in 2022 (Statista)
In 2019, the eCommerce share of global retail sales amounted to 13.8%. In 2021, the share was already up to 19.6%. That’s an increase of almost 6% in just 2 years. (Printful)
United States T-shirt Statistics
Revenue in the U.S. T-Shirts segment was US $5.04bn in 2022. The market is expected to grow annually by 3.97% (Statista)
In relation to total population figures, per person U.S. revenues of US$15.06 were generated in 2022 (Statista)
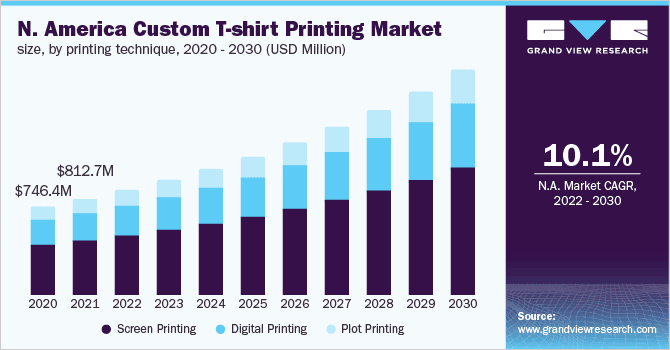
The custom t-shirt printing market was valued at $812.7m in 2021, and has a 10.1 % expected compound annual growth rate from 2022-2030 (Grand View Research)
In the U.S. T-Shirts segment, volume is expected to amount to 1,100 million pcs. by 2026. (Statista)
The average volume per person in the U.S. T-Shirts segment is expected to amount to 2.91 pieces in 2022 (Statista)
Custom T-shirt Printing Statistics
Over 2,000 million (2 billion) t-shirts are sold every year (Credence Research)
Screen printing is the largest segment of global Custom T-shirt Printing with over 50% share in 2020 (Credence Research)
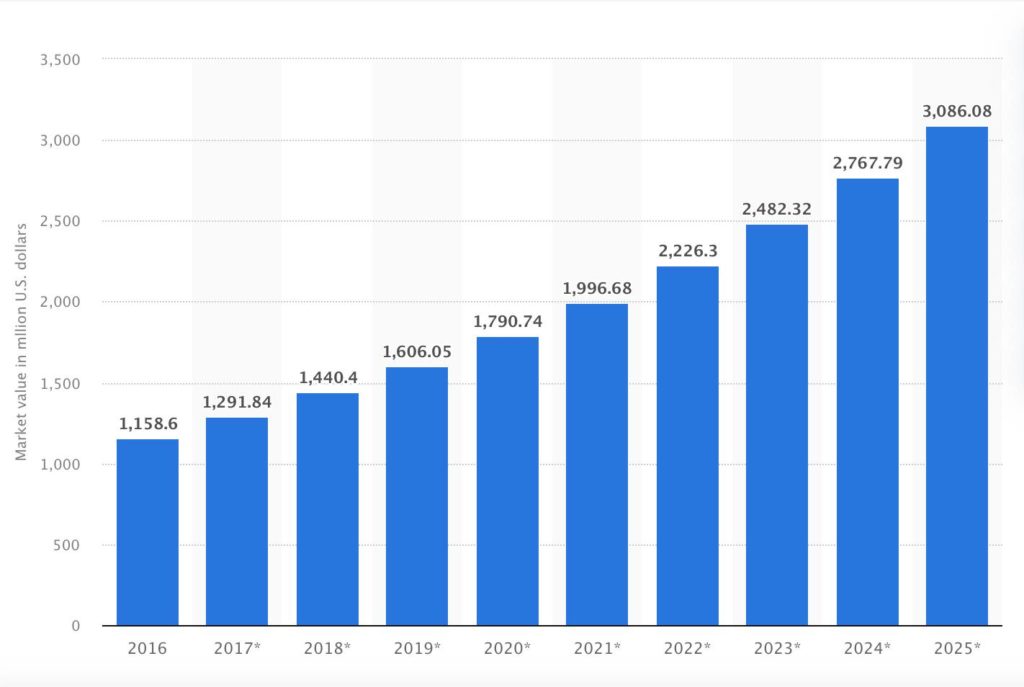
In 2016, the global custom t-shirt printing market was valued at 1.16 billion U.S. dollars and was forecast to reach a value of 3.1 billion U.S. dollars by 2025. (Statista)
There’s a growing demand for personalized products. 36% of consumers are expecting some form of t-shirt personalization by default. (Printful)
T-shirt Business Statistics
The digital printing industry started in 1993 and grew exponentially to be worth $187.7 billion in 2018, just 25 years later. (Comcap)
From 2017 to 2020, the print-on-demand apparel industry grew at a compound annual growth rate of 12%. (Comcap)
In April 2021, clothing products made up nearly 16% of all products dropshipped on Shopify. (Statista)
In 2021, the screen-printing segment of the t-shirt industry held the highest revenue share of more than 56%. (Grand View Research)
T-shirt Sustainability Statistics
Digital printing technology reduces the consumption of water by nearly 90% and lowers the electric consumption by nearly 30%. (Fortune Business Insights)
In a 2021 survey, 27% of respondents said that, in the last 12 months, they tried out a new product for sustainability reasons and 25% spent more money on sustainable fashion. (Statista)
55% of apparel business owners say that sustainability is part of their business focus. (Printful)
About 40% of survey respondents say it’s very important that the products they sell are eco-friendly (Printful)
Products made from natural, organic (80%) materials are considered by survey respondents to be the most eco-friendly (Printful)
Nearly 40% of survey respondents claim it’s very important that the production process is carbon neutral (Printful)
Printify T-shirt Statistics
In June 2020 alone, the number of orders Printify stores received was more than 400,000, which is a growth of 311% compared to the same period the previous year. (Printify)
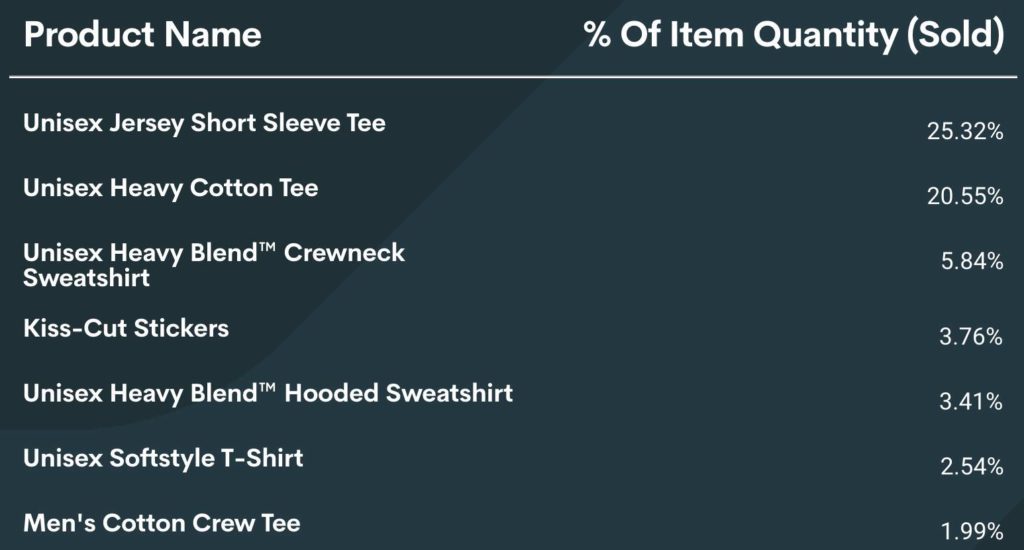
The best-selling product group in September 2021 was apparel. It accounted for 62.38% of all items sold. (Printify)
The most popular product in September 2021 was Unisex Jersey Short Sleeve Tee. It accounted for 25.32% of all items sold, from which black – 18% – was the most popular color choice. (Printify)
General T-shirt Statistics
Nearly 80% of Americans in all demographic groups say they feel a sense of attachment to at least one of their old t-shirts, and that shirt is most likely to be one that was acquired on vacation (Blue Cotton)
A nationwide study was undertaken to learn the fate of all the t-shirts created for sports leagues, fraternity parties, church camps, fundraising events, and innumerable other groups and activities. The survey found that 79% of respondents still have an old shirt and that the average number of shirts per person is 2.5. (Blue Cotton)
27% of respondents own a shirt from their favorite pro or college sports team, while just 17% have a shirt from a team they were on. (Blue Cotton)

Shirts picked up on vacation are respondents’ favorite, cited by nearly half (48%) of those surveyed. The research also found that shirts from a business employer, a concert, a favorite pro or college sports team, and a charity run/walk also are popular. (Blue Cotton)
The most likely age group to hang on to old t-shirts are those between ages 18 and 24, of whom just 7% (compared with 21% of the overall population) say they haven’t kept a shirt, the survey found. (Blue Cotton)
70% of respondents age 65+ also still hold onto a favorite tee. (Blue Cotton)
Younger respondents are also far more likely than their older counterparts to keep a shirt from a concert. 46.5% of 18-24-year-olds had an old concert shirt. (Blue Cotton)

There is a big gap between minimum and maximum machine productivity figures for making casual shirts. It ranges from 5 pieces to 32 pieces per day. (Online Clothing Study)
Bryan E. Robinson is the former owner of TshirtGrowth. He has sold t-shirts since 2006 through dropshipping, screen printing, vinyl printing, DTG, Print on Demand, and more. Bryan has created his own t-shirt designs through Photoshop, Canva, and other platforms, as well as worked with freelancers to create many of his designs. Besides t-shirts, Bryan has over 18 years of experience in online marketing with eCommerce, B2B SaaS, B2C products, and more.


